
Ask an AI about this page
 ChatGPT
 Claude
 Perplexity
 Google AI Mode
 Microsoft Copilot
 Grok
Grok Mistral Le Chat
Analyse your BCL sales in Power BI
Updated

BCL has no built-in Power BI connector, but your sales data moves across easily. Export your paid transactions from BCL, tidy the file in Excel, and build a report in Power BI Desktop (free) that shows revenue by form, by payment channel and by day. If you are comfortable with APIs, Power BI can also read your transactions straight from the BCL API.
Export your paid transactions
Section titled “Export your paid transactions”Start with an Excel file of your successful payments:
-
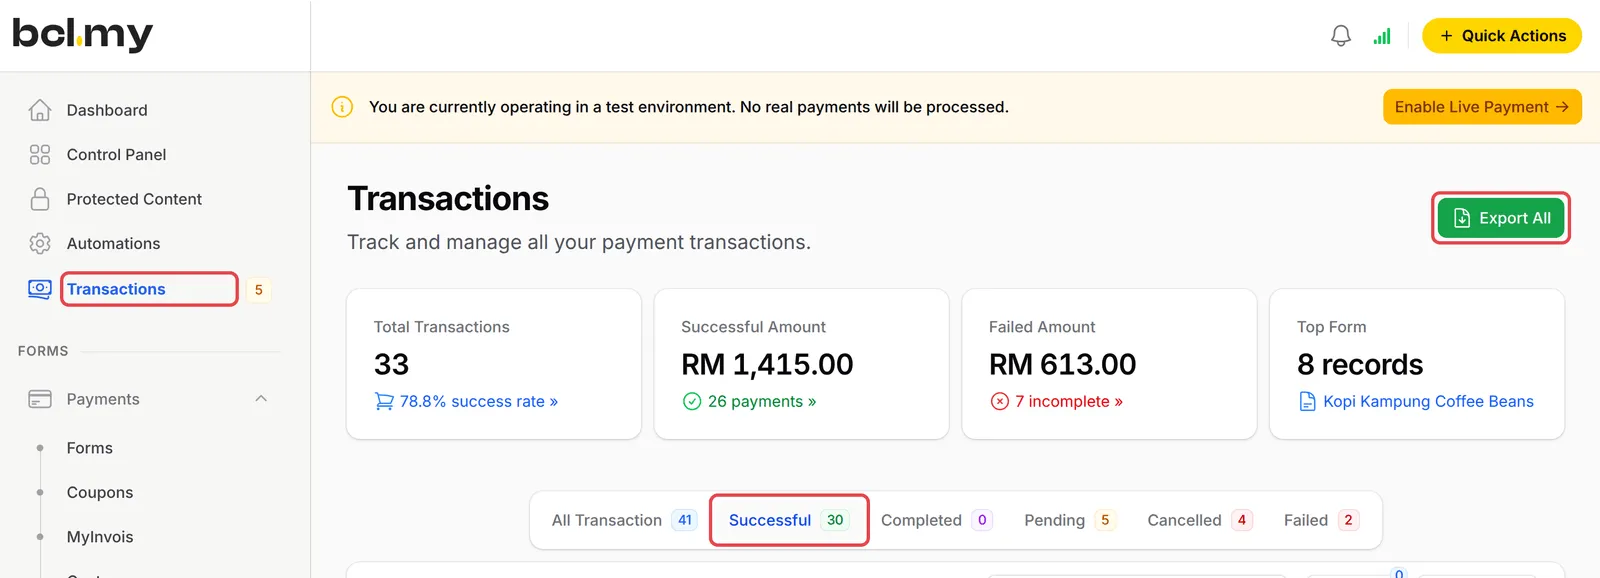
In the sidebar, click Transactions.
-
Click the Successful tab, then click Export All.
-
Keep the default columns and click Submit. The Excel file downloads.
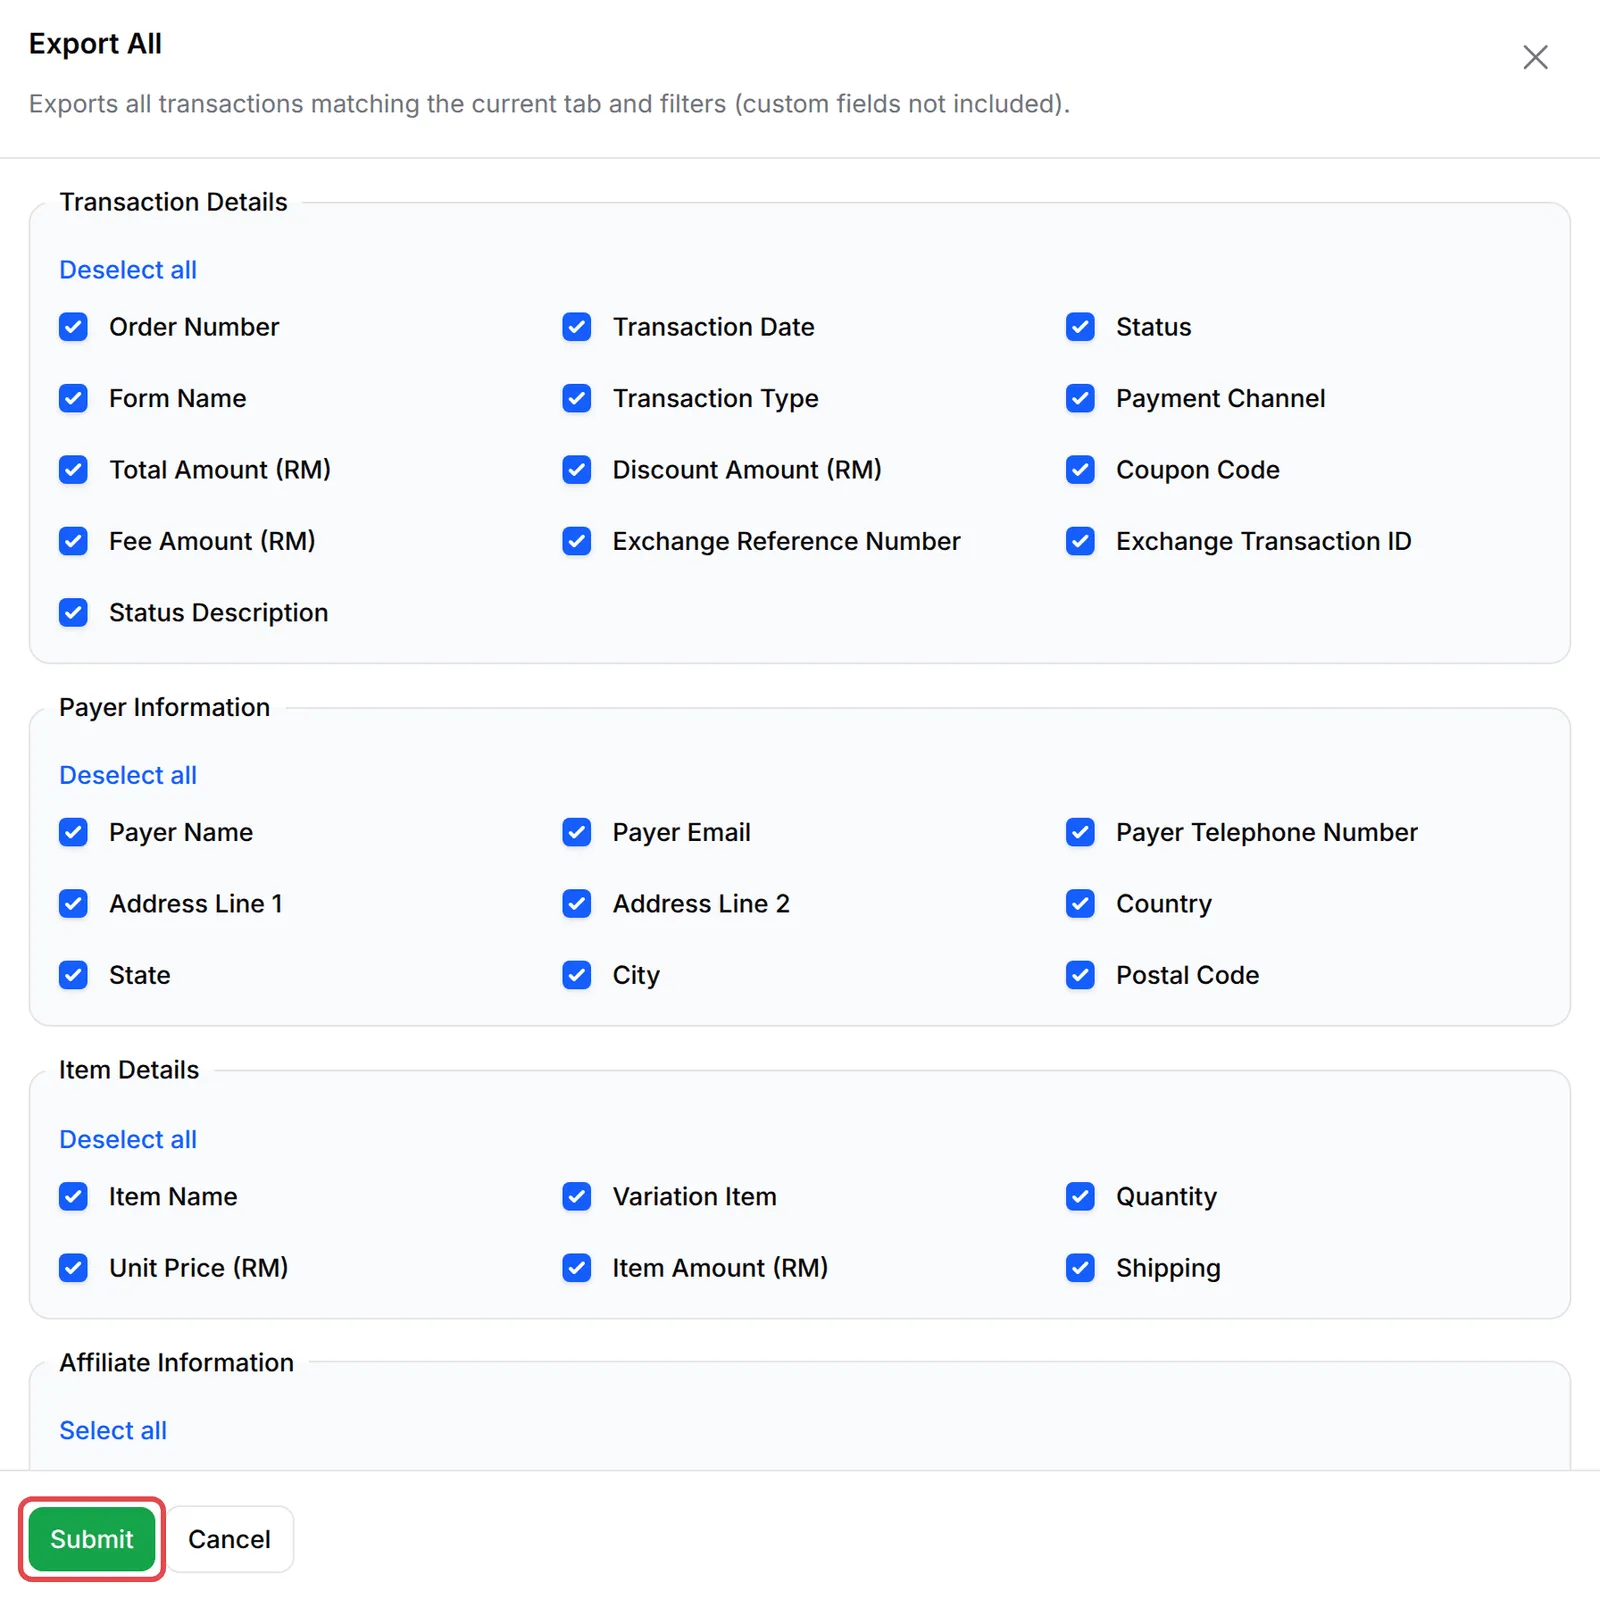
For all the export options, see Export your transactions.
Keep one row per order
Section titled “Keep one row per order”The export has one row for each item in an order, and every row repeats the order’s Total Amount (RM). Remove the extra rows first, or Power BI counts those orders more than once:
-
Open the file in Excel, or in Excel for the web after you upload it to OneDrive.
-
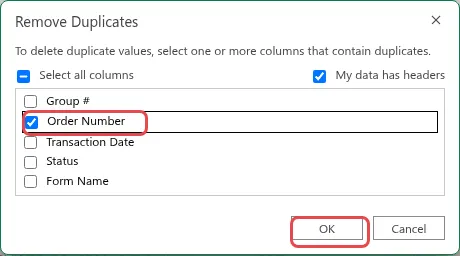
Click Data → Remove Duplicates.
-
Untick Select all columns, tick only Order Number, keep My data has headers ticked and click OK.
-
Save the file.
Excel tells you how many duplicate rows it removed. The rows left are one per paid order.
Build the report in Power BI Desktop
Section titled “Build the report in Power BI Desktop”Power BI Desktop is a free Windows app from Microsoft. Build the report there, then publish it to the Power BI service:
-
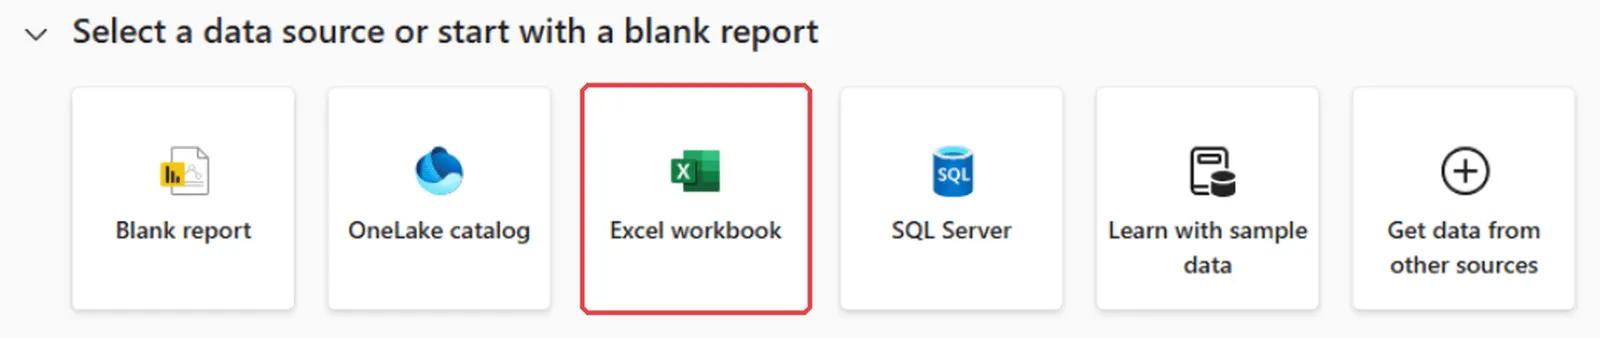
Open Power BI Desktop and click Excel workbook.
-
Choose your saved export. In the Navigator, tick Worksheet and click Load.
-
Add these three visuals from the Visualizations pane, ticking the fields in the Data pane:
Visual Fields What it shows Clustered bar chart Form Name, Total Amount (RM) Revenue by form Donut chart Payment Channel, Total Amount (RM) Revenue by payment channel, such as FPX or DuitNow QR Clustered column chart Transaction Date (by day), Total Amount (RM) Revenue by day -
Save the report, then click Publish and choose My workspace. Open the report at app.powerbi.com to view it in your browser or share it inside your organisation.
To update the report, export again, replace the file, and click Refresh in Power BI Desktop before you publish again.
Advanced: read your sales from the BCL API
Section titled “Advanced: read your sales from the BCL API”Power BI Desktop can call the BCL API instead of reading an export. You need a BCL API token with the API Read permission, from Platform Setup → Integrations → API Token. See API tokens.
-
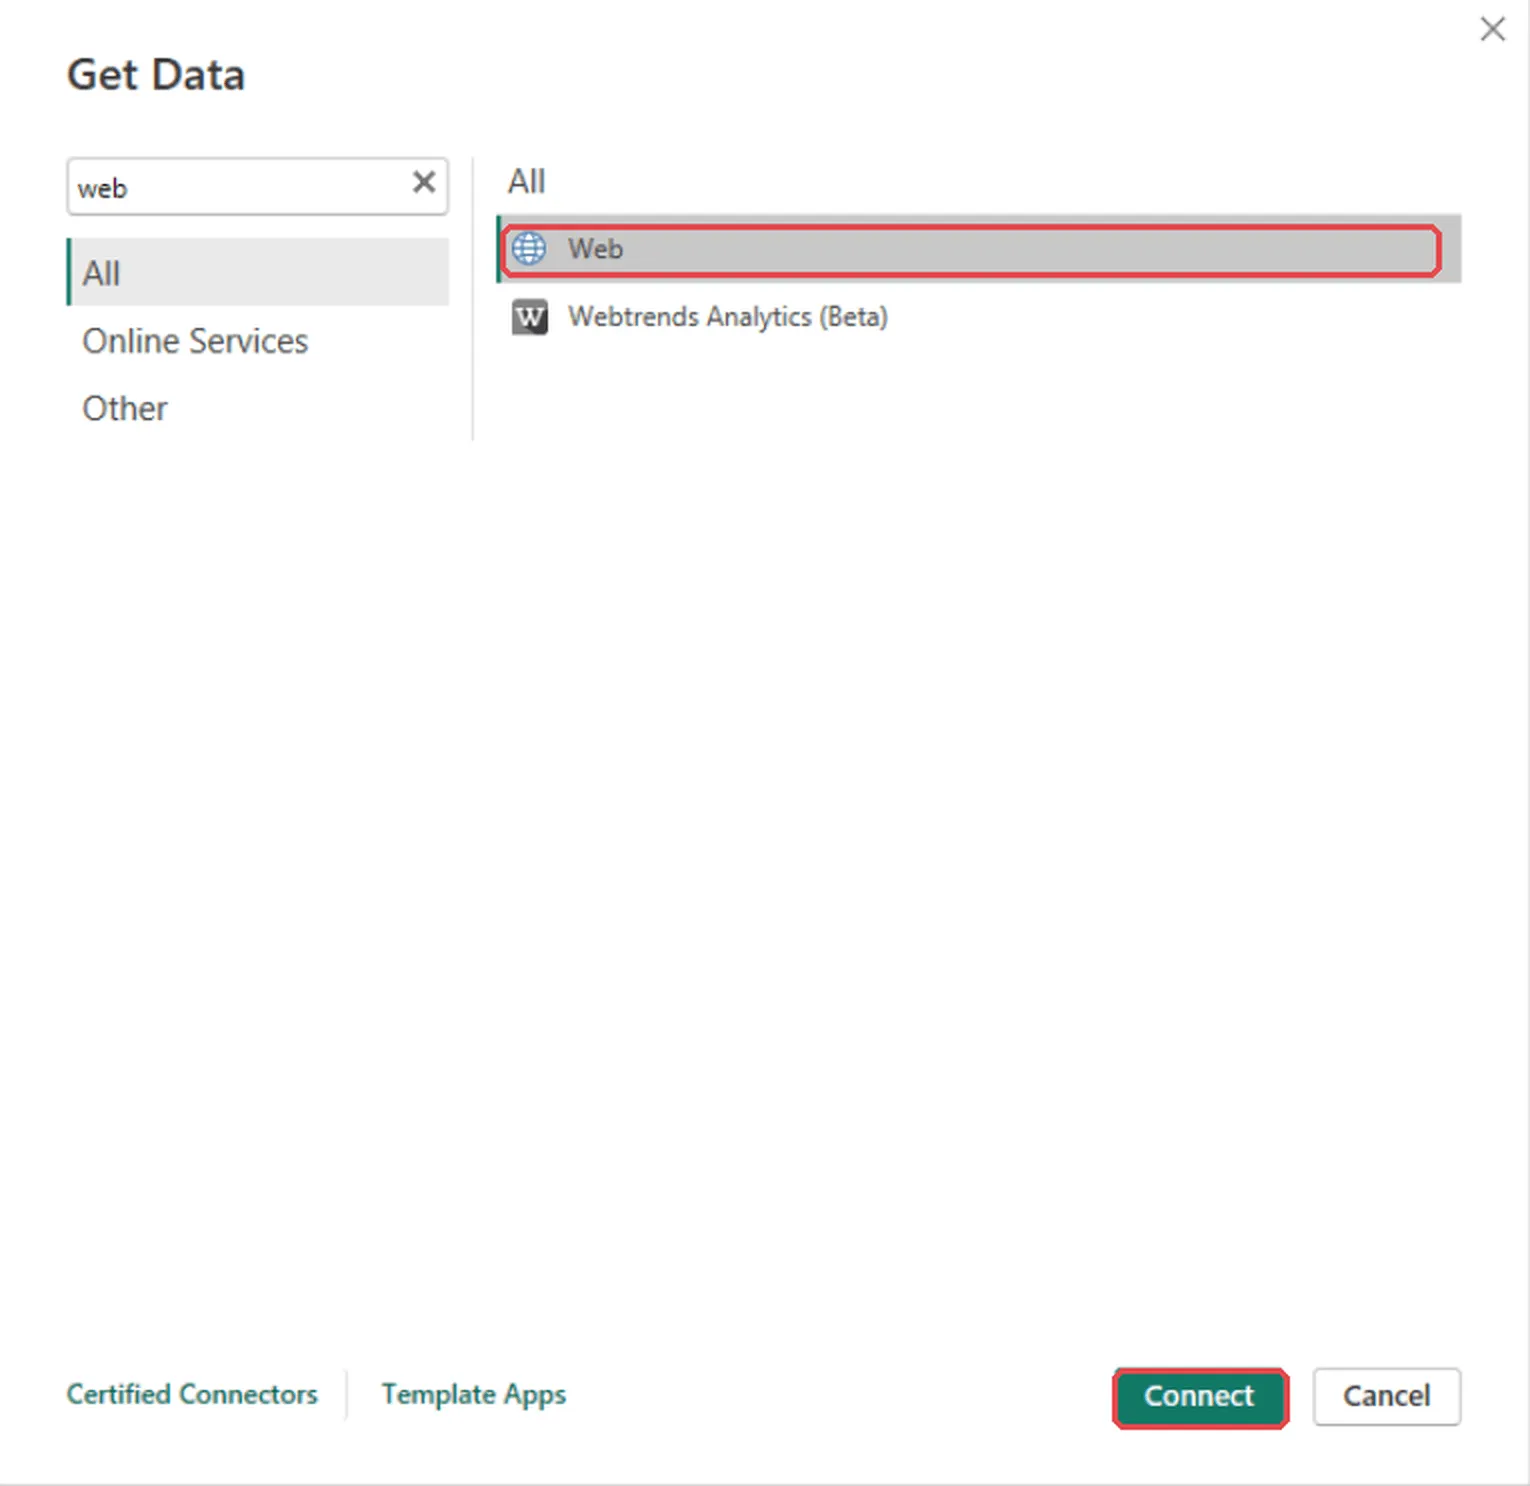
In Power BI Desktop, click Get data from other sources on the start page (or Get data on the Home tab), search for Web, select it and click Connect.
-
Choose Advanced. Enter
https://api.bcl.my/v1/transactionsand?per_page=100as URL parts. Under HTTP request header parameters, add Authorization withBearerfollowed by your token, click Add header, and add User-Agent with a name for your app, for exampleKopiKampung-PowerBI/1.0. BCL refuses requests without a proper User-Agent. Click OK.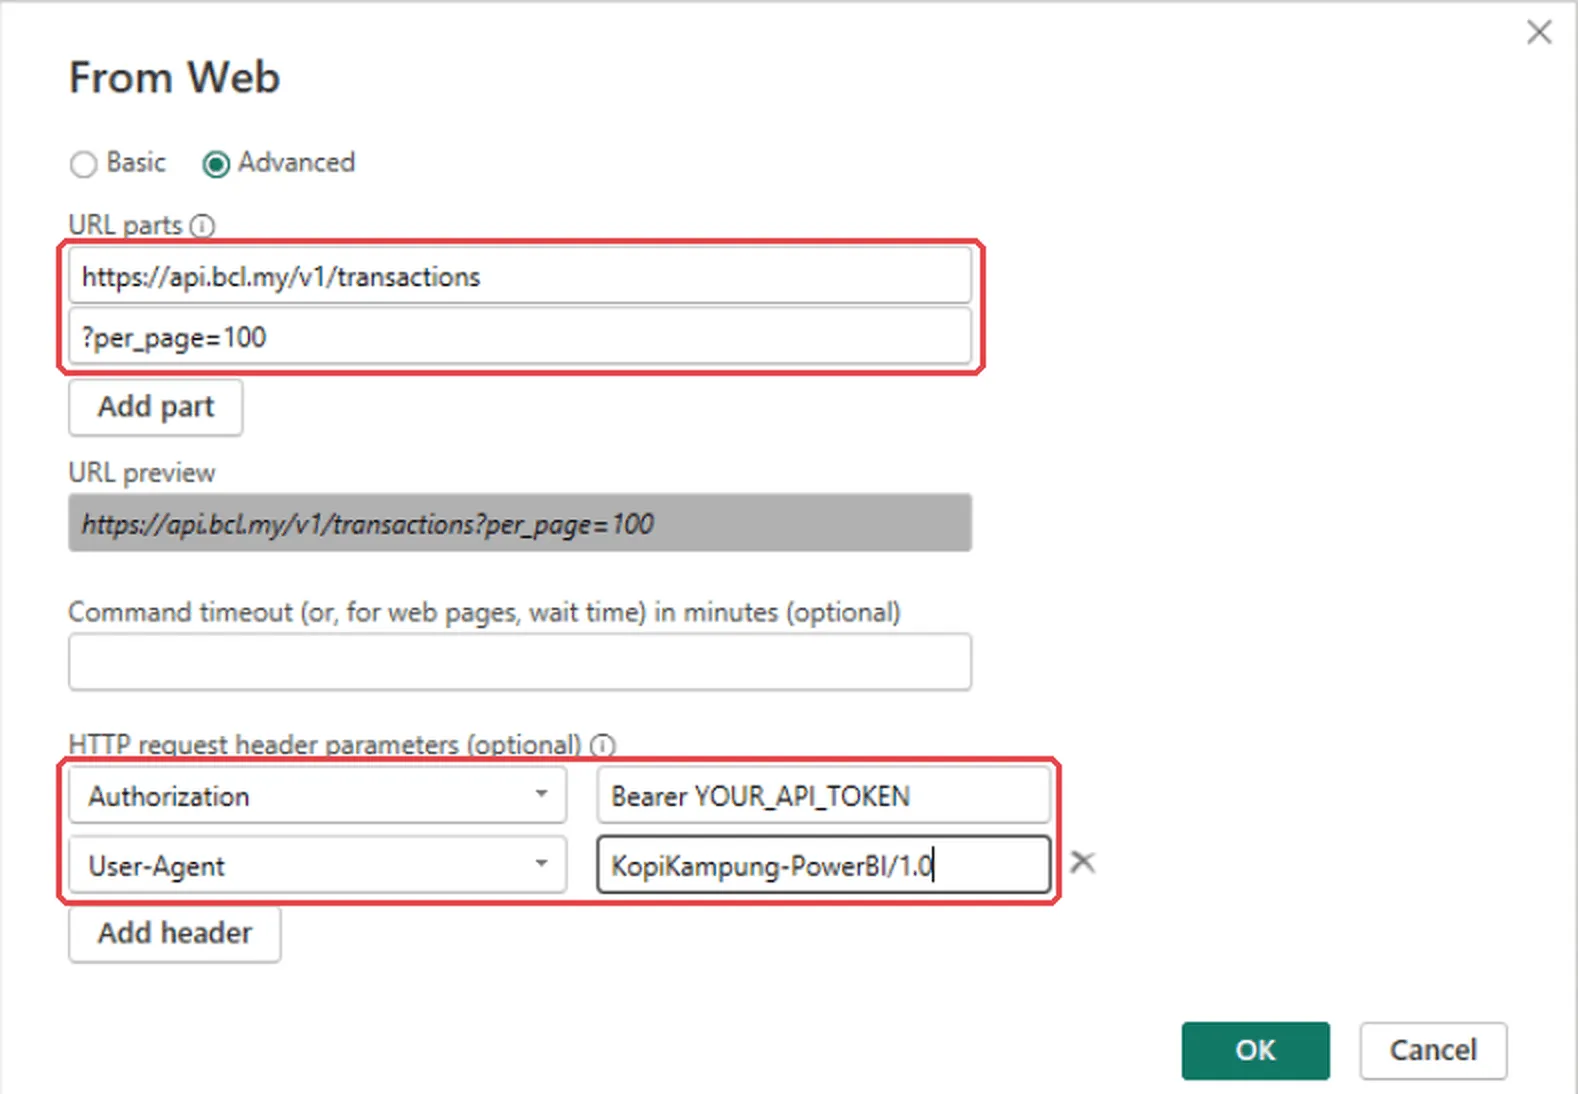
-
If Power BI asks how to connect, choose Anonymous and click Connect. Your token already travels in the header. Power Query opens and turns the JSON into a table.
That first query reads one page of up to 100 transactions. To read every page and keep only the columns you need, click Advanced Editor in Power Query and replace the query with this one. Put your token in place of YOUR_API_TOKEN:
let Token = "YOUR_API_TOKEN", GetPage = (page as number) => Json.Document(Web.Contents("https://api.bcl.my/v1", [ RelativePath = "transactions", Query = [per_page = "100", page = Number.ToText(page)], Headers = [ Authorization = "Bearer " & Token, #"User-Agent" = "KopiKampung-PowerBI/1.0", Accept = "application/json" ] ])), FirstPage = GetPage(1), AllRows = List.Combine( List.Transform({1..FirstPage[meta][last_page]}, each GetPage(_)[data]) ), Orders = Table.FromRecords(AllRows, {"order_number", "created_at", "payer_name", "amount", "status", "payment_channel", "form_type", "remarks"}, MissingField.UseNull), Typed = Table.TransformColumnTypes(Orders, {{"created_at", type datetime}, {"amount", type number}})in Typed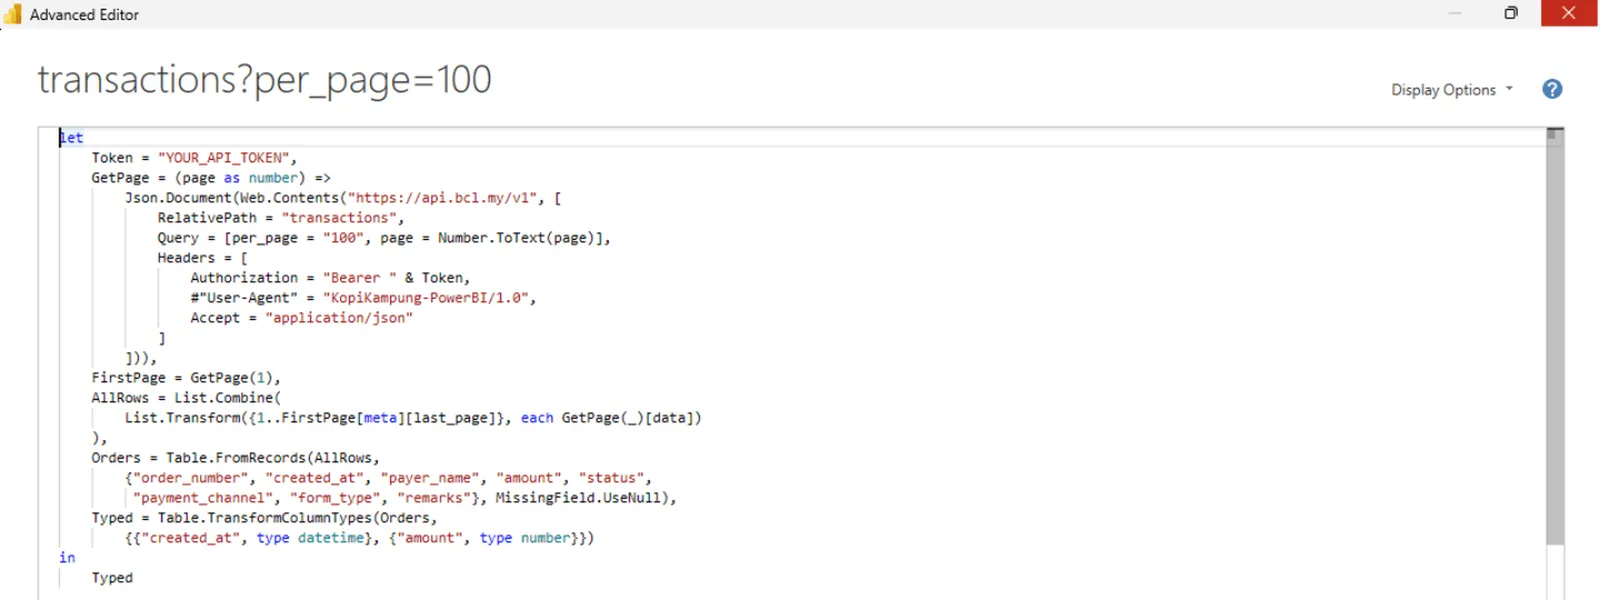
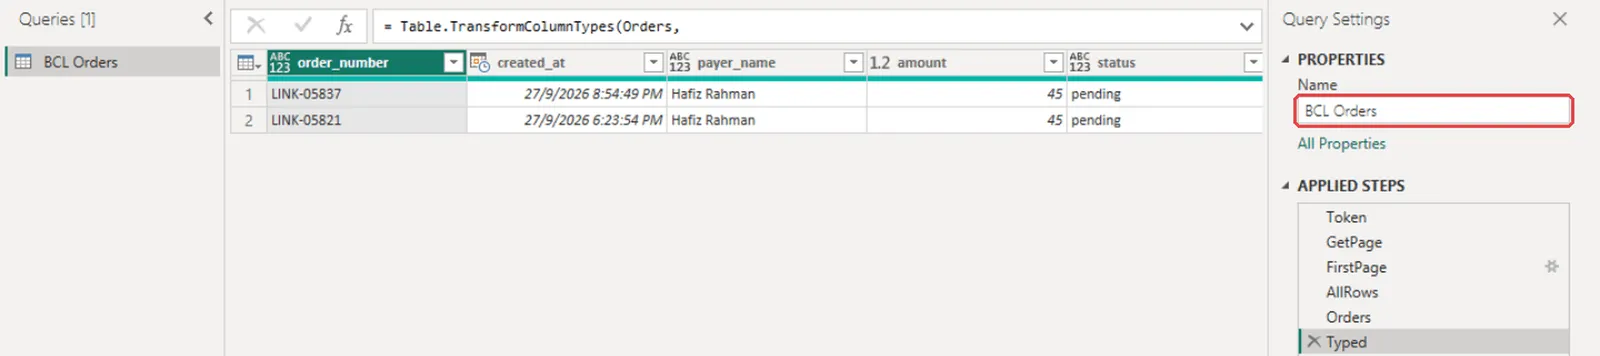
Click Done, name the query (for example BCL Orders) under Query Settings, and click Close & Apply. The API returns one row per transaction, so there are no item rows to remove. It includes every status, so filter the status column to successful payments before you add up revenue.
A few habits keep your report accurate and safe:
- Export the Successful tab only. Pending, failed and cancelled payments in the export would inflate your revenue.
- Use the same file name each time. Replace the old export with the new one under the same name, and a Refresh in Power BI Desktop picks up the new data without rebuilding the visuals.
- Keep your API token out of shared files. The token sits inside the report’s query. Do not send the .pbix file to people who should not read your BCL data, and give the token only the API Read permission.
- Want new orders in Excel as they happen? See Send orders to Excel with Power Automate.
Common issues
Why is my revenue in Power BI higher than in BCL?
The BCL export has one row per item, and each row repeats the order's Total Amount (RM). Remove duplicate rows on Order Number before you add up the totals.
Can Power BI read my BCL data directly?
Yes, with Power BI Desktop and the BCL API. Use Get data → Web, send your API token in an Authorization header and set your own User-Agent. The API lists live transactions only.
I imported the Excel file into the Power BI service and only see the spreadsheet. Why?
The Power BI service opens an imported Excel file as a workbook to view, not as data for a report. Build the report in Power BI Desktop, then publish it to your workspace.
Was this article helpful?
Thanks for your feedback.
Sorry this didn't help. WhatsApp us and we'll sort it out with you.